
Population Ecology
Populations grow exponentially under ideal conditions but logistically as resources become limiting, and life-history strategies reflect trade-offs shaped by selection.
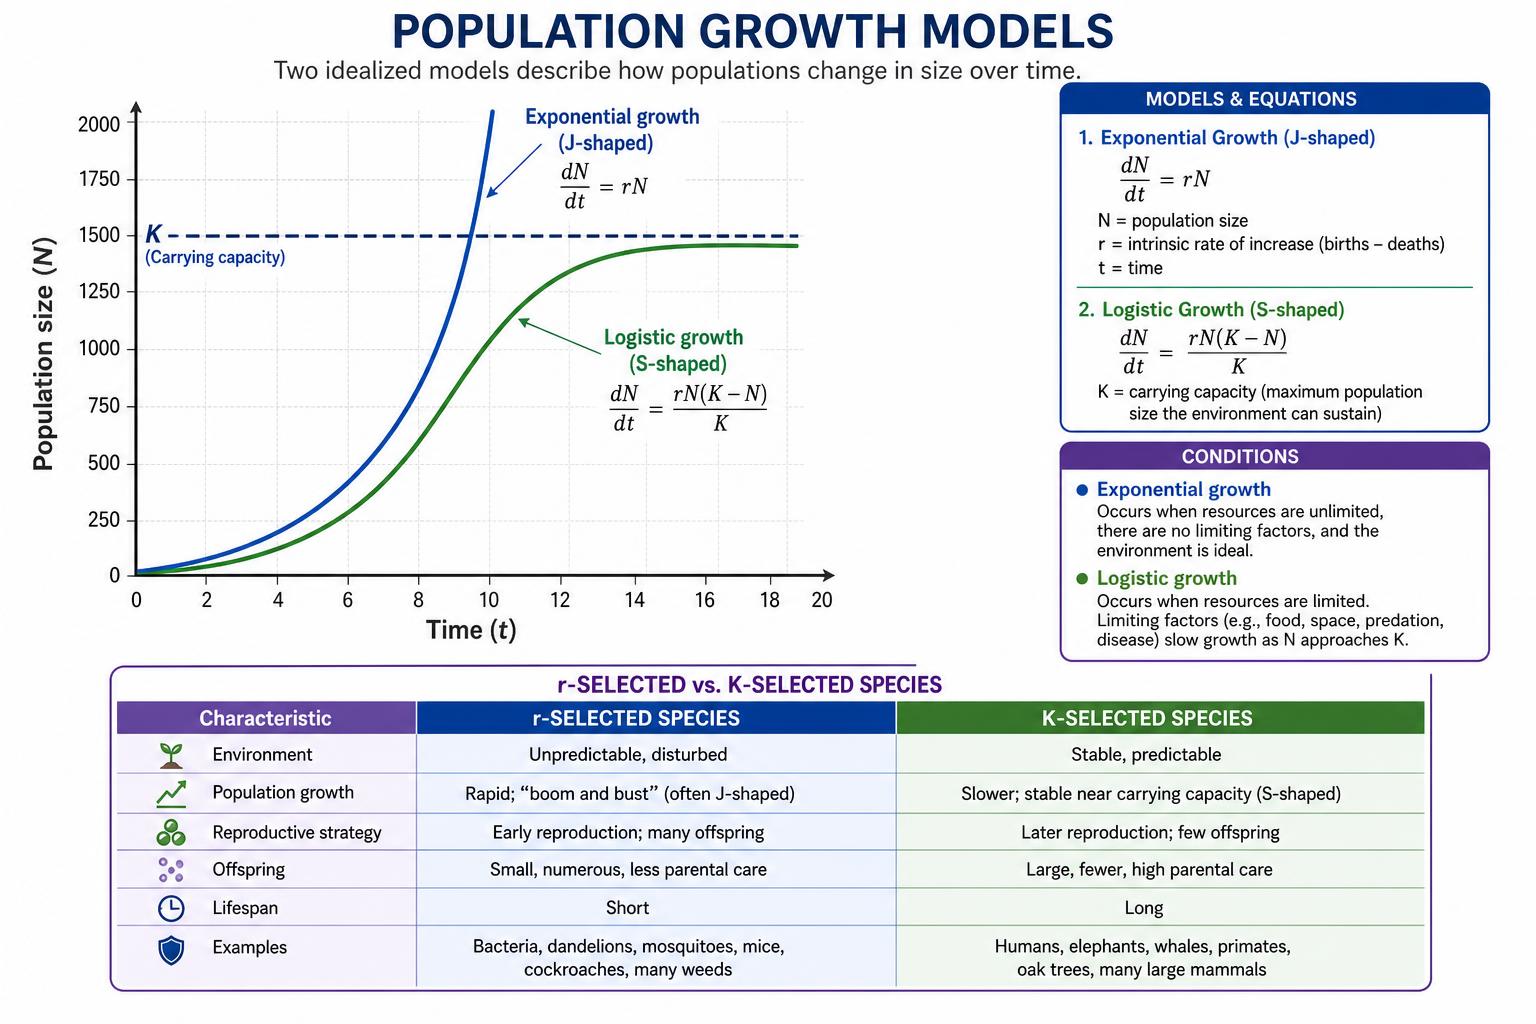
Exponential growth
Under unlimited resources, populations grow exponentially, described by dN/dt = rN, where N is population size and r is the intrinsic (per-capita) rate of increase. This produces a J-shaped curve that becomes progressively steeper because the same percentage growth rate is applied to an ever-larger N.
True exponential growth is rare and short-lived in nature because resources are always eventually limiting. It is observed briefly when populations colonize new, resource-rich environments - bacteria introduced into a fresh nutrient medium, or an invasive species entering a habitat without natural predators or competitors.
Logistic growth and carrying capacity
A more realistic model incorporates limiting resources: dN/dt = rN(K−N)/K, where K is the carrying capacity, the maximum population size the environment can sustain long-term given food, space, water, and other resources. As N approaches K, the term (K−N)/K approaches zero, so the growth rate slows and eventually plateaus, producing a sigmoidal (S-shaped) curve.
Real populations often oscillate around K rather than settling exactly at it, due to time lags in resource depletion and reproductive response, environmental variability, and interactions with other species (predators, competitors, disease).
Life-history strategies: r-selection vs. K-selection
r-selected species (many insects, weeds, bacteria) are adapted to exploit unstable, unpredictable, or newly available environments: they have a high intrinsic growth rate, produce many small offspring, provide little or no parental care, mature early, and have short lifespans. Their strategy maximizes reproductive output when density-independent mortality is high and resources are temporarily abundant.
K-selected species (elephants, whales, humans) are adapted to stable environments near carrying capacity: they produce few, large offspring, invest heavily in parental care, mature late, and live long lives. This strategy maximizes competitive ability under crowded, resource-limited conditions.
Age structure and survivorship
Age-structure diagrams display the number or proportion of individuals in each age class, allowing prediction of future population trends: a wide base (many pre-reproductive individuals) predicts future growth, an even distribution predicts stability, and a narrow base predicts decline.
Survivorship curves describe the pattern of mortality across a cohort's lifetime. Type I curves show high survival through most of life with mortality concentrated late (humans, large mammals); Type II curves show a roughly constant mortality rate at all ages (many birds, small mammals); Type III curves show very high mortality early in life with high survival of the few that reach maturity (most fish, invertebrates, plants).
Key terms
5
- Carrying capacity (K)
- The maximum population size an environment can sustain indefinitely given available resources.
- Intrinsic growth rate (r)
- The per-capita rate of population increase under ideal, unlimited conditions.
- Exponential growth
- Growth pattern producing a J-shaped curve, occurring when resources are not limiting.
- Logistic growth
- Growth pattern producing an S-shaped curve as growth rate slows near carrying capacity.
- Survivorship curve
- A graph showing the pattern of survival of a cohort over its lifespan.
Sign-off
Finish this lesson
A lesson only counts once you've read all the way through and completed every activity on the page.
- Read the full lesson (scroll to the end)
- Complete all activities (0/1 done)