
Phylogeny
Phylogenetic trees and cladograms visually represent hypothesized evolutionary relationships based on shared derived characteristics.
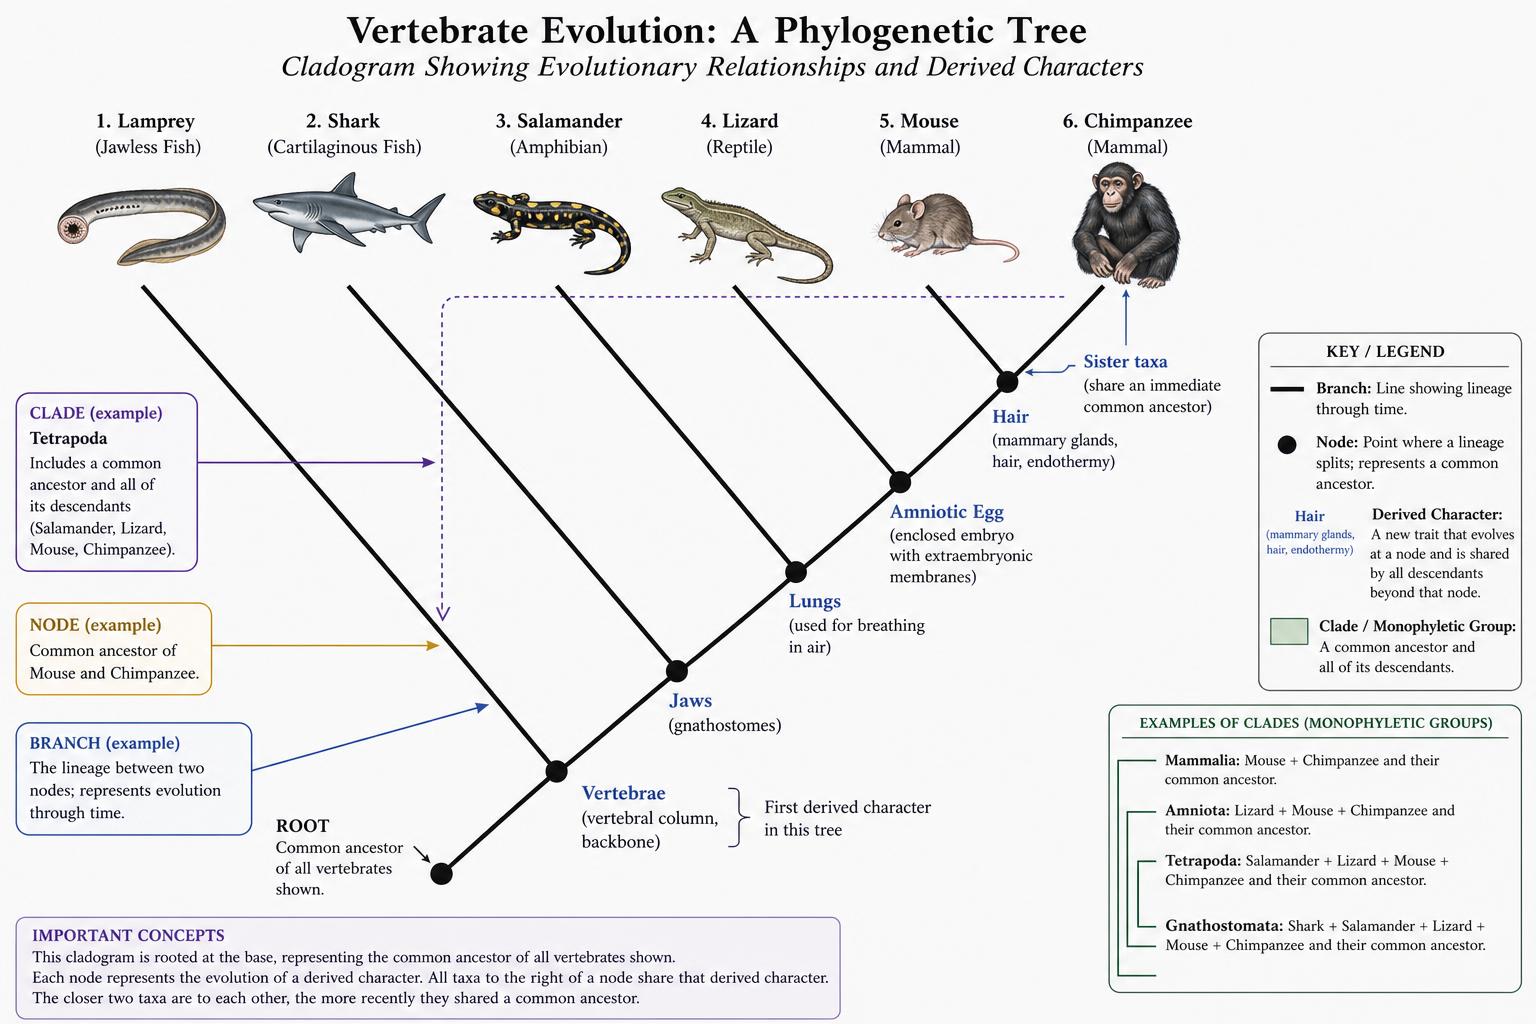
Reading and interpreting trees
A phylogenetic tree represents a hypothesis about evolutionary relationships, built from available anatomical and/or molecular evidence - it is not a certain, unchangeable fact, and trees are revised as new evidence emerges. Each internal branch point (node) represents a hypothesized common ancestor of the lineages branching from it. Two taxa that share a more recent common ancestor (fewer nodes separating them from that ancestor) are considered more closely related than taxa separated by more, older branch points.
A critical skill is recognizing that rotating branches around a node does not change the tree's meaning - only the branching order (topology), not the left-right arrangement of the tips, conveys relationships. Two trees that look different superficially can represent identical relationships if their branching order is the same.
Building trees from shared derived characters
Cladograms are built by identifying synapomorphies - derived traits (a changed form of an ancestral trait) shared by a group of organisms and inherited from their most recent common ancestor. Organisms are grouped into clades: a common ancestor plus all its descendants, forming a monophyletic group. A trait present in the common ancestor of a very large group (like a backbone in vertebrates) is not useful for distinguishing relationships within that group, since it doesn't tell us about more recent divergences - only traits that changed more recently are informative.
The principle of parsimony guides tree construction: among competing hypotheses, biologists generally favor the tree requiring the fewest independent evolutionary changes (least assumed convergent evolution or reversals), since this is the simplest explanation consistent with the data.
Molecular phylogenetics
Modern phylogenetics increasingly relies on DNA and protein sequence comparisons rather than morphology alone. Molecular data offer several advantages: they can be quantitatively compared (percent sequence identity), they are less subject to the ambiguity of convergent morphological evolution, and they can reveal relationships among organisms too morphologically similar (or dissimilar) to classify confidently by anatomy alone, such as among microorganisms.
Because different genes evolve at different rates, researchers can choose rapidly evolving genes to resolve relationships among very closely related, recently diverged species, and slowly evolving, highly conserved genes (like ribosomal RNA genes) to resolve very ancient, deep branching relationships, such as those separating the three domains of life.
Key terms
4
- Phylogenetic tree
- A branching diagram representing hypothesized evolutionary relationships among organisms.
- Cladogram
- A tree diagram that groups organisms based on shared derived characteristics.
- Synapomorphy
- A derived trait shared by a group of organisms and their most recent common ancestor, used to define clades.
- Clade
- A group consisting of a common ancestor and all of its descendants (a monophyletic group).
Sign-off
Finish this lesson
A lesson only counts once you've read all the way through and completed every activity on the page.
- Read the full lesson (scroll to the end)
- Complete all activities (0/1 done)