
Chi-Square Analysis in Genetics
Testing whether observed offspring ratios really differ from your prediction.
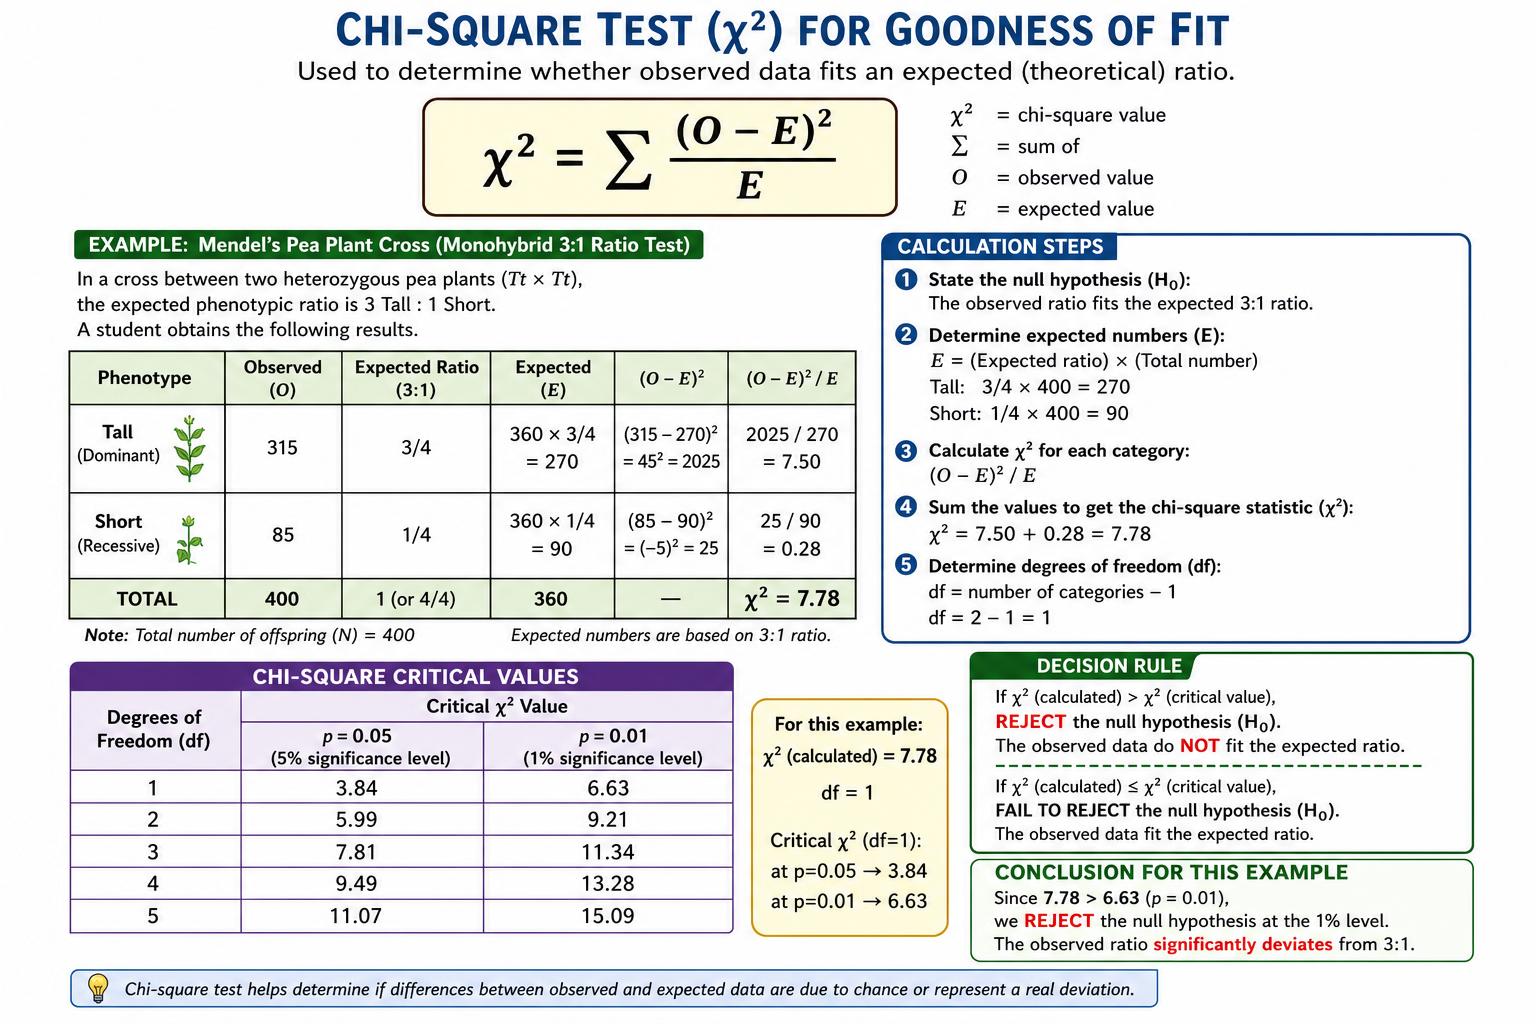
Setting up the test
Start by stating a null hypothesis - for a monohybrid cross of two heterozygotes, that offspring will occur in a 3:1 phenotypic ratio. Convert that ratio into expected counts using the actual total number of offspring, not percentages.
Then compute (observed - expected)² / expected for every category and add the results. That sum is χ².
Worked example
Cross Pp × Pp, 160 offspring. Expected: 120 purple, 40 white. Observed: 132 purple, 28 white.
Purple: (132 - 120)² / 120 = 144/120 = 1.20. White: (28 - 40)² / 40 = 144/40 = 3.60. χ² = 4.80. With two categories, df = 1, and the critical value at p = 0.05 is 3.84.
Because 4.80 > 3.84, reject the null hypothesis: the deviation is unlikely to be due to chance alone, so something other than a simple 3:1 model is going on.
Writing the conclusion
- χ² < critical value → fail to reject the null; the data are consistent with the predicted ratio.
- χ² ≥ critical value → reject the null; the deviation is statistically significant.
- Never say you 'accept' the null hypothesis - you only fail to reject it.
- Always report the df and the critical value you compared against.
Key terms
3
- Null hypothesis
- The assumption that any difference between observed and expected results is due to chance alone.
- Degrees of freedom
- Number of outcome categories minus one.
- p = 0.05
- The conventional cutoff: a 5% or lower probability that chance alone explains the deviation.
Sign-off
Finish this lesson
A lesson only counts once you've read all the way through and completed every activity on the page.
- Read the full lesson (scroll to the end)
- Complete all activities (0/1 done)